#
DESIGNATION
ROTATION
ROTATION
PROOF
TEST
LINE
LOADS
LOADS
numbers
| pinwheel corp | bobs numbers | 3/4/2002 | ||||||||||
| Indexer II final cable installation data compared to bob's program results | ||||||||||||
| all angular data and dimensions required for manufacture of cables | ||||||||||||
| see color code page for number code correlation | ||||||||||||
| all cable assemblies proof tested to 10,000 pounds | ||||||||||||
| line loads measured with deflection type tensiometer | ||||||||||||
| serial number specific to each assembly. | ||||||||||||
| provides long term tracking ability with regards to manufacture and longterm inspection or replacement | ||||||||||||
| CABLE # |
LETTER DESIGNATION |
LENGTH | TAILSTOCK ROTATION |
HORIZONTAL | HEADSTOCK ROTATION |
10,000 PROOF TEST |
MOCKUP LINE LOADS |
INSTALLATION LOADS |
bobs numbers |
|||
|---|---|---|---|---|---|---|---|---|---|---|---|---|
| 1 | (A) : (B) | 3' - 9 9/16 | 66 | 24.1 | 20.4 | 7/16" | 3200 | 2450 | 224.24 | |||
| 2 | (A) : (C) | 6' - 3 15/16 | -39.5 | 34.9 | 32.7 | 3/4" | <1000 | <1000 | 38.21 | |||
| 3 | (A) : (D) | 8' - 0 3/16 | -12.2 | 4.9 | 58.9 | 1" | 1700 | 1500 | 147.89 | |||
| 4 | (C) : (D) | 8' - 0 1/8 | -48.1 | 18.4 | 46.4 | 1" | <1000 | <1000 | 66.34 | |||
| 5 | (A) : D | 6' - 1 1/16 | -48.7 | 29.9 | -45.8 | 3/4" | 1750 | 1500 | 165.46 | |||
| 6 | (B) : A | 6' - 10 13/16 | -47.2 | 26.3 | 75.1 | 7/8" | 4800 | 3600 | 349.11 | |||
| 7 | (B) : D | 3' - 4 1/16 | 32.2 | 33.1 | -34.4 | 7/16" | 1750 | 1000 | 121.68 | |||
| 8 | (C) : A | 6' - 3 13/16 | 18.2 | 19 | -51 | 3/4" | <1000 | <1000 | 62.19 | |||
| 9 | (D) : C | 5' - 1 1/4 | 54.3 | 42.7 | -10.6 | 5/8" | 2350 | 1800 | 215.65 | |||
| 10 | A : B | 9' - 6 3/8 | 2.8 | 15.3 | 65.7 | 1 3/16" | <1000 | <1000 | 78.06 | |||
| 11 | A : C | 7' - 1 3/8 | -40.3 | 30.5 | 36.6 | 7/8" | <1000 | <1000 | 58.71 | |||
| 12 | B : C | 9' - 5 1/2 | -58.4 | 42.5 | -32.7 | 1 3/16" | <1000 | <1000 | 79.1 | |||
| 13 | B : D | 12' - 1 1/8 | -76.7 | 29.7 | 14.1 | 1 1/2" | 1700 | 1500 | 145.14 | |||
| 14 | C : D | 6' - 6 9/16 | -19.6 | 16.4 | 69.2 | 13/16" | 1650 | 1400 | 156.82 | |||
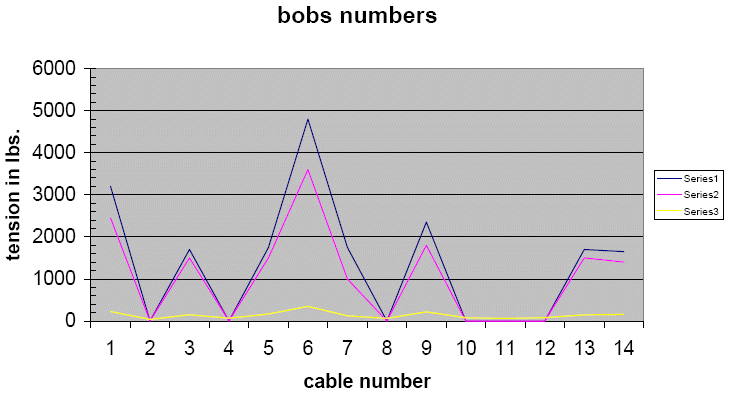
| the chart below shows the resting line levels in the assembled sculpture, the yellow line are bob's numbers | ||||||||||||
| note how the tension in the overall network increases proportionately | ||||||||||||
| the pink line represents the installation at time of mockup | ||||||||||||
| the blue line represents the installation at time of final assembly. | ||||||||||||
| the difference stems from temperature variations and minute assemble differences.(I.e. the tendons were screwed in slightly further…) | ||||||||||||
|
| ||||||||||||
| INDEXERCABLE | stu | |||||||||||